Reporter tutorial: basics
This tutorial provides step by step instructions for using the most common features available in the Reporter, helping you build skills as the lessons progress. A single report is used for the lessons. You can use any section independently (such as going straight to "Lesson 6" to learn how to set up a chart), but you may need to improvise with your own report as the starting point.
Report Types, Criteria and Setup, and Finding Reports
The Maintenance Connection Reporter includes over 300 standard reports for your use. These reports can be copied and configured to match your organization's unique needs. This lesson will introduce you to the types of reports available, provide an overview of the two main components of the Reporter (Report Criteria and Report Setup), and show you how to find reports using the Report Lookup.
Report Types
The Reporter includes several types of reports as described below:
List/Detail Reports: These types of reports list records, often grouped with totals at the group level. This tutorial will show how to create a list report, including the preparation of an accompanying chart.
Summary/Pivot Reports: Summary Reports perform calculations such as counts, sums, and averages. A common summary report you can create is called a "pivot" report, which allows for dynamic aggregations of data along two dimensions. Data can be aggregated by field values such as "shop" and "status," or even by date aggregations such as months, quarters, or days of the week. Instructions for creating summary reports can be found in Reporter Tutorial: Advanced and Reporter Tutorial: Pivot Reports.
Custom Formatted Reports: Maintenance Connection also includes custom formatted reports that are coded outside of the MC Reporter. In these types of reports, such as the printed "Work Order Report", the layout cannot be modified using Report Setup options. When a custom report is selected and run, there is no Setup option available from the Report Preview toolbar.
Report Components: Criteria and Setup
Report Criteria determines which records will be included in your report:
Report criteria determines the rows displayed in Detail/List Reports:
- If no criteria is defined, all records will be displayed in the report.
- You build your criteria until the desired result set is defined.
- The more criteria you define, the more filtered your results will be (less records returned).
Report Setup determines what data/columns will be displayed (report presentation):
- Fields/columns to display.
- General display of the report, including Layout, Sorting/Grouping, and Settings.
- Style/Format.
- Charts/KPI definition.
Find Reports: Using the Report Lookup
To access the Reporter, select Reports from the toolbar.
The Report Lookup will display, listing reports for the module currently accessed.
The Report Group folders on the left organize the display of available reports. Selecting a Report Group folder will open that group, refreshing the contents of the Report List on the right with reports from that group.
The icons to the left of the report names, which display a tooltip when your mouse is placed over them, indicate the following:

At the top of the Report Lookup are filter and search controls to assist in locating specific reports. In addition to filtering reports by Repair Center, you can filter by Report Type (e.g., Base Reports that came with the system, or Copied Reports that were tailored for your use). The Search By controls on the right allow you to search for reports by name. As with other MC searches, you can use the "%" wildcard to search for a report with the specified value anywhere in the report name.
The Report List can initially appear overwhelming, as there are so many reports from which to choose! Keep in mind, however, that there are many similar reports included in the list. For example, there are many "list" and "count" reports. If you wanted to create/copy a work order list report, any one of these reports would most likely serve your purpose.
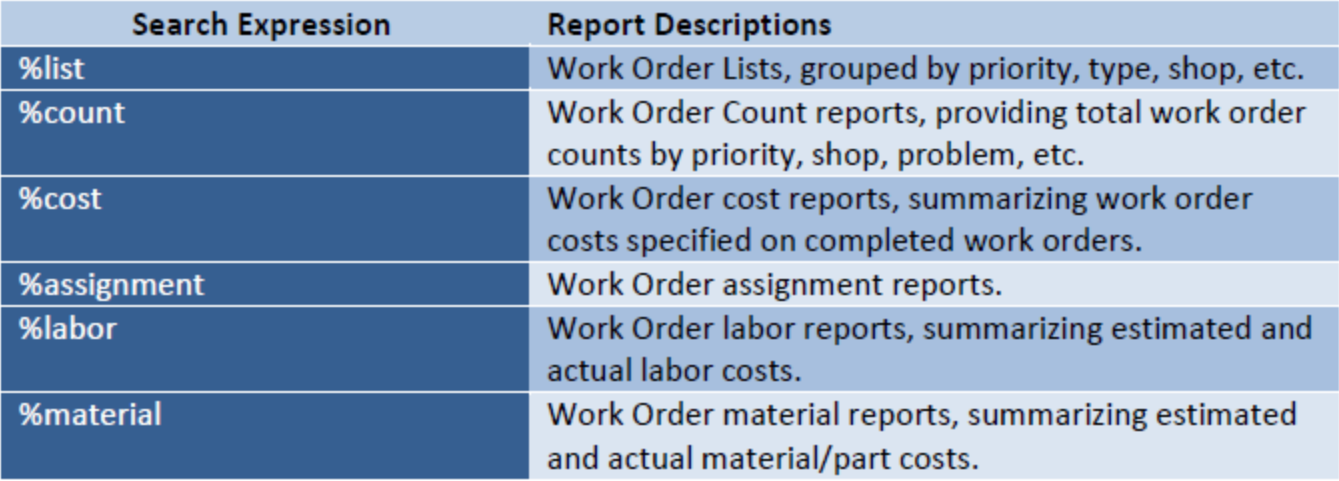
The following search strings are helpful to filter to particular types of reports in the Work Order module:
While you can modify and run any report included in the Reporter, it is wise to create a copy to work with, so that the base reports remain as originally defined. This is especially important during training and initial setup, as many changes are likely to be made. It is also helpful to set up custom report groups to provide quick access to the reports you use most.
Create Your Own Tutorial Training Report
Let's create a tutorial training report to use so that we do not alter the base reports included with the system:
- Select the Work Order (Open) Reports folder on the left.
- The Report List on the right will display all reports currently in the selected Work Order (Open) Reports group/folder. Locate the Open Work Order List and select it. Once it has been selected, click Copy Report.
- The report will open in the Report Copy window, showing standard options for Report Setup. At the top of the window, enter a name for your report, such as "YourName - Open Work Orders - TEST." It is helpful to put the word TEST (or SAMPLE) in reports used for training, so that they are easily identified later.
- Specify a Repair Center in the Managed By prompt if the report should only be viewable by a particular Repair Center. To make the report viewable by all, select All Repair Centers. The logged in user's Repair Center will be shown by default.
- Click Apply when you are finished and you will return to the Report Lookup. The new report is likely to display by default, depending on what it was named and the "Managed By" Repair Center to which it was associated. If your new report does not display by default, modify the filters at the top or page through the Report List to locate it.
Create and Manage Custom Report Groups
Custom Report Groups allow you to organize your reports for quicker access and provide a defined subset of available reports for particular groups. For example, a "Technician" report group could be created that included reports such as "My Open Assignments" and "My PM Assignments for This Month," without providing technicians with access to the complete set of Work Order Reports in use at your organization.
Let's ensure that there is a Custom Report Group set up for use at your organization and place our new report in that group for easy access.
- Ensure you are viewing the Report Lookup. Then, click the Custom Groups tab to the left of the Report List.
- To create a new group for your organization, right click on the first Custom Group displayed, and select New Report Group.
- Enter a desired Report Group ID and Report Group Name for your Report Group. Only the Report Group Name will show in the Report Lookup.
- You must select an initial report to be included in this Report Group. Locate the report you just created, select it, and click the right arrow to move it into the Reports Assigned To Group Box.
- Click Apply to return to the Report Lookup.
- Your new Custom Report Group should be listed and available for your use.
Tip: Once a report group has been established, you can add or remove reports from it by right clicking on the folder from the Custom Group Tab and selecting Edit Report Group. You can also add and remove individual reports from the group from a report's Setup window, using the Groups>Custom Groups sub-tab.
Now you are ready to run your new report and modify the Report Criteria and Setup as needed.
Run Report and Report Criteria
Each time you run a report, you are prompted to review or modify the Report Criteria, specifying the records that will be displayed. The report is then presented in the Report Preview window, allowing you to view, print, or email the displayed report. Further, if "On the Fly" criteria has been added to the Report, users can change report criteria dynamically within the Report Preview itself:
Run Report
To select and run a report in the Report Preview window:
- Open the Report Lookup and select the Report Group on the left to narrow down the list of reports. If you have Custom Report Groups defined, select the group from the Custom Groups sub-tab to find reports you have placed in this group. With your newly-created Custom Group, the report you created earlier should be quite easy to find.
- Once you have located the desired report, click on it to select it and then click Run Report (or simply double click on the report name).
- The Report Criteria window will display allowing you to modify the criteria for this report.
- To run this report without changing any report criteria, you would click Apply, which would open the report in the Report Preview window. To continue with the tutorial, however, we will learn more about modifying/setting the Report Criteria.
Define Your Report Criteria
Report Criteria, which filters the records that will be included in a report, are specified in the Report Criteria dialog. The Report Criteria dialog appears when you run a report (or click the Criteria button from the toolbar of the Report Preview window).
The list of fields available to create your criteria will vary depending on the type of report.
Fixed Criteria listed at the top of the dialog are defined by MC (or you) on the Advanced tab of the Report Setup window. Criteria to limit work order reports to only display open OR closed work orders is specified for most Work Order reports.
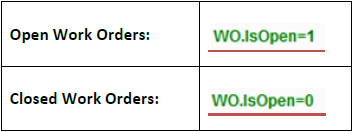
When fixed criteria is defined, the actual SQL expression is shown. In Maintenance Connection, a bit (or checkbox) field called "IsOpen" is used to track whether or not a work order is open. The value "0" corresponds to false/no, while "1" corresponds to true/yes. As such, WO.IsOpen=1 means the value for "IsOpen" is true, returning only open work orders.
Note: Users with appropriate permission can modify the fields available in the Report Criteria window or change the fixed criteria displayed at the top.
Each row on the Report Criteria dialog allows you to define an expression that will indicate which records to include (or exclude) on the report. The more expressions that are defined, the more filtered your results will be. For each field listed, prompts are provided to create a logical expression to filter your data. Each expression that is used to define your criteria has three parts:
- The field on which the expression will be based ("Target Date" in the above example).
- The value that the expression must meet ("Current Year" in the above example).
- The control that defines the relationship between the field and the value ("is within" in the above example). This control can also be thought of as determining how the field will be evaluated.
Let's build report criteria for the following:
Open Work Orders, Not PM, Not On Hold, Targeted in Current Year
- Since we copied the Open Work Order List Report, fixed criteria will already be defined and displayed at the top for "WO.IsOpen=1," ensuring only open work orders will show on the report.
- To limit the report to exclude work orders on hold, scroll down to the Status field, select is not for the operator, and On-Hold for the value.
- Locate the Target Dat prompt, select is within for the operator, and Current Year for the value. If you have a lot of data in your system, you can set this to Current Month or Last Month.
- Lastly, scroll to the bottom of the list until you see the prompt for "Generated?" This field determines whether or not the work order is a Generated PM. Since we do not want PM Work Orders, select "is" for the operator, and "No" for the value.
- To save the changes made to Report Criteria so that they will be honored each time you run the report, click the Save button at the bottom of the dialog.
- To apply your changes and run this report, click Apply.
- Your newly-defined report will display in the Report Preview window. The data that will be displayed will depend on the work orders available from your system that match the defined criteria.
- Once the report displays, we can use the Setup button on the toolbar to refine the layout/presentation:
Define Report Criteria On the Fly
Administrators and users with proper permissions can set up "on the fly" report criteria which allows everyone accessing the report to adjust the criteria dynamically from with the Report Preview window.
If on the fly criteria has been added to the Report, the designated criteria fields will display at the top of the Report Preview. Users can adjust criteria for these fields using the same process described above. In this example, we will change the Target Date criteria from within the Report itself.
- There is currently no criteria set for the Target Date, as shown.
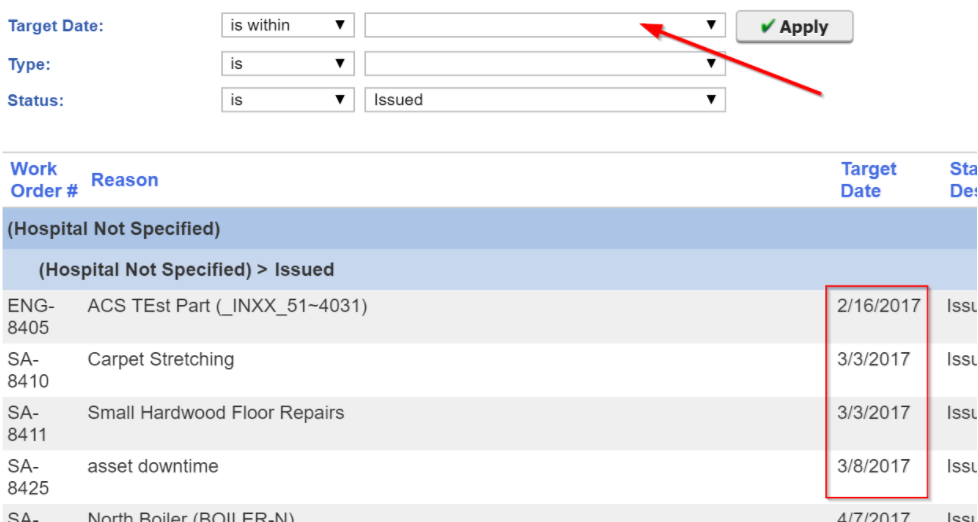
- We will change the Target Date criteria to show only Work Orders with a Target Date within the current month up to the current date. To do this, select the "Month To Date" option in the Target Date field, and then click Apply.
- Now, notice how the data shown has changed to fit the new "on the fly" criteria:
Once a report is displayed in the Report Preview window, you can click Setup in the toolbar to access the Report Setup window, from which you can modify many aspects of the report presentation.
Note: You can also access Report Setup directly from the Report Lookup, but this method does not allow you to toggle back and forth between Report Preview and Setup as you continue to modify and refine the report.
The fields/columns to be displayed on the report are listed at the top of the Report Setup window. When the report is shown in the Report Preview window it will include all fields listed in the Display column on the right, in the order shown. Based on the report we copied for this training session, the following fields should be listed:
Let's modify this field list:
- Let's add the name of the individual making the Work Order request:
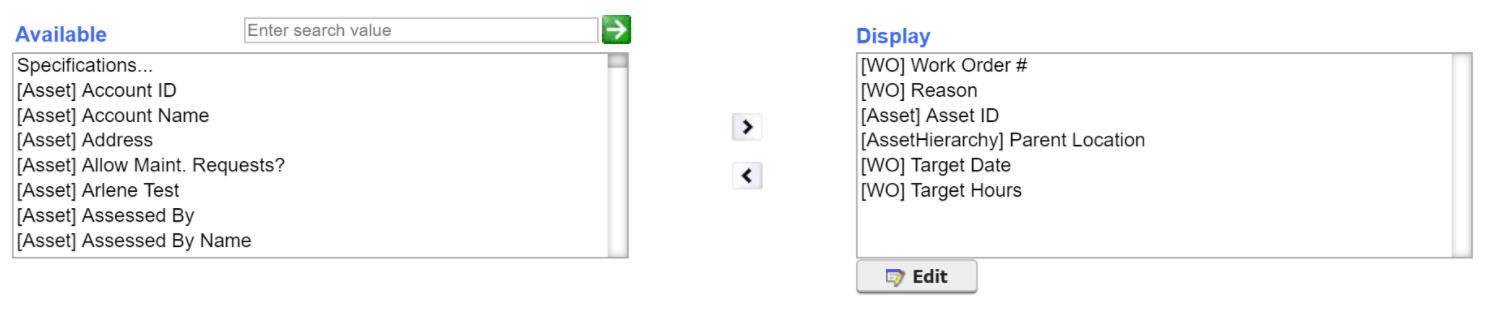
- To add a field, we must locate it in the Available fields list on the left. The fields that are available will depend on the type of report. For example, for work order reports, fields from the [Asset] and [Work Order] tables will be available. In addition, below the [Asset] fields, you will find fields from the [AssetHierarchy] Table. These are the hierarchical definitions in your tree, as defined for your organization in the Asset Hierarchy Configuration tool. For example, if your organization's asset tree is organized by Site and Building, these options should be available for you in the list, as well as standard options for asset parent information (the parent location of the specified asset).
- To select the Requester, input the word "requester" into the Available search prompt. From the results that appear in the list, select [WO] Requester Name.
- Click on the right arrow to move the field to the Display fields list (or just double click on the Requester Name field from the Available fields list).
- The field will move to the Display fields list.
- Now let's replace the Asset ID field with Asset Name (in our example, we will presume that the Asset Name field is more informative for this report):
- To remove the AssetID field, select it in the Display fields list on the right and click the left arrow (or just double click on the field name).
- To add the Asset Name field, search for it via the search prompt, and select [Asset] Asset Name field from the Available fields list. Once again, click the right arrow.
- The Display fields list should now appear as follows:
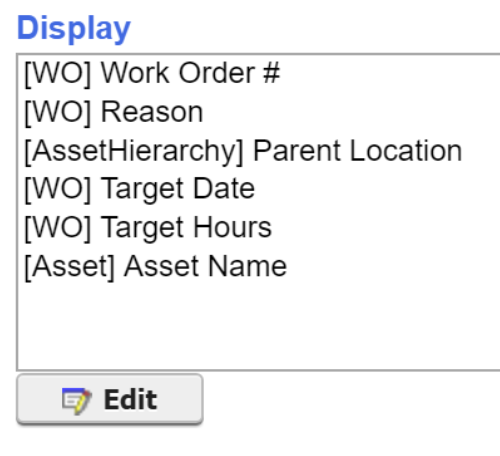
- To reorder fields, the up/down arrows to the right of the Display fields list are used. Let's move the Asset Name field just above Parent Location. Click on the Asset Name field to select it, and then click the up arrow until the field is displayed as you wish.
- Use the same process to move the Requester Name field to just after the Work Order # field.
- Let's take a look at how our report has changed. Click the Apply button at the bottom of the dialog to return to the Report Preview window.
Let's return to Report Setup to modify the order that records in the report are displayed, as well as any defined report grouping.
The General>Sort/Group sub-tab will display by default. The sort displayed will be dependent on your organization's configuration:
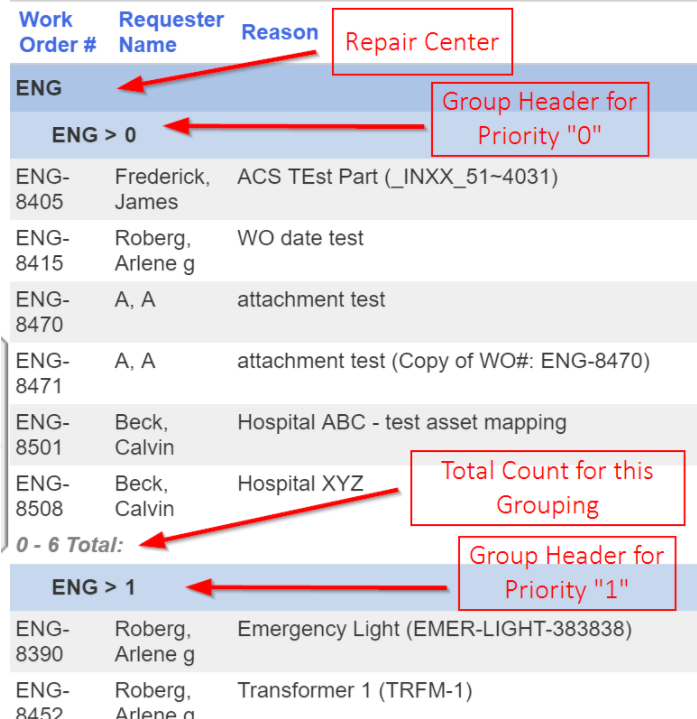
Records in the report will be ordered in the sort order specified. For each sort order defined, you can designate whether the sort should be ascending or descending. If the Group checkbox is used, all records of the same type (sort value) will be grouped together.
Let's modify the sort definition to ensure the report is grouped by Repair Center and Priority and then further ordered by Target Date:
- Let's start by clearing out the existing sort definition, so we can specify the desired fields. To clear out all defined sort fields, select the first sort field dropdown control, scroll all the way to the top of the available options and select None. All Sort Fields should then be cleared. For a handy tip, note that hitting the "N" key will automatically select "None" so you don't have to scroll to the top.
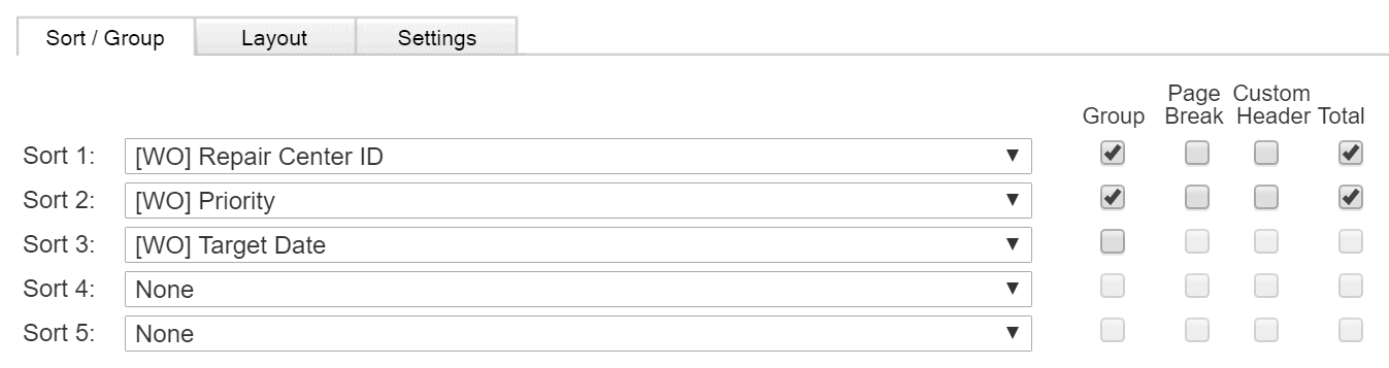
- To ensure total values display at the end of your report, it is beneficial to have your first sort be the highest level of grouping in the system. As such, for the first sort field, let's sort by Repair Center. Click on the Sort 1 dropdown and scroll down to the [WO] Repair Center fields. You will notice there are 4 values available. You can sort by the Repair Center ID or Repair Center Name, and you can also specify whether the sort should be ascending or descending. Let's select [WO] Repair Center Name, so we will get an ascending sort on this field.
- Click on the Sort 2 dropdown and scroll down to the [WO] Priority fields. You can sort by the Priority Code (1,2,3) or Priority Desc (HIGH, NORMAL). Let's select [WO] Priority Desc, so we will get an ascending sort on this field.
- To group records by Repair Center and Priority and ensure there are total counts for fields within these groups, we'll mark the indicators to Group and Total for both Sort 1 and Sort 2. Note that you must first select the Group option before being able to select the other checkboxes.
Note: The Total option will provide a total for all numeric fields within the group (and at the end of the report). If you do not want to show totals for a specific numeric field, select the field in the Display Fields list, click the Edit button, and set the Total If Selected field to No. This field will be set to Yes for all fields by default.
- In the Sort 3 prompt, select the [WO] Target Date field, so that the Work Orders for each priority will sort by target date, with the oldest due dates at the top. There is no need for a separate grouping by this field, since we only want the records sorted by the date. Your sort definition should appear as follows:
- Click Apply to preview this report as now defined. The Report Preview window will display:
Return to Report Setup to define or modify the chart displayed.
Charts can be used to enhance the appearance of reports and provide a visual indicator of important data. Charts can summarize the same data that is listed in the report, or can provide a different slice of the same data. For example, a report listing (or counting) work orders by priority could include a pie chart that showed this same count. Alternatively, the chart for the report could show a count of the same work orders by type of problem.
To define a chart for a report:
- From the Report Setup window, click the Charts/KPIs tab and select the Chart sub-tab on which the chart is to be defined (typically Chart 1).
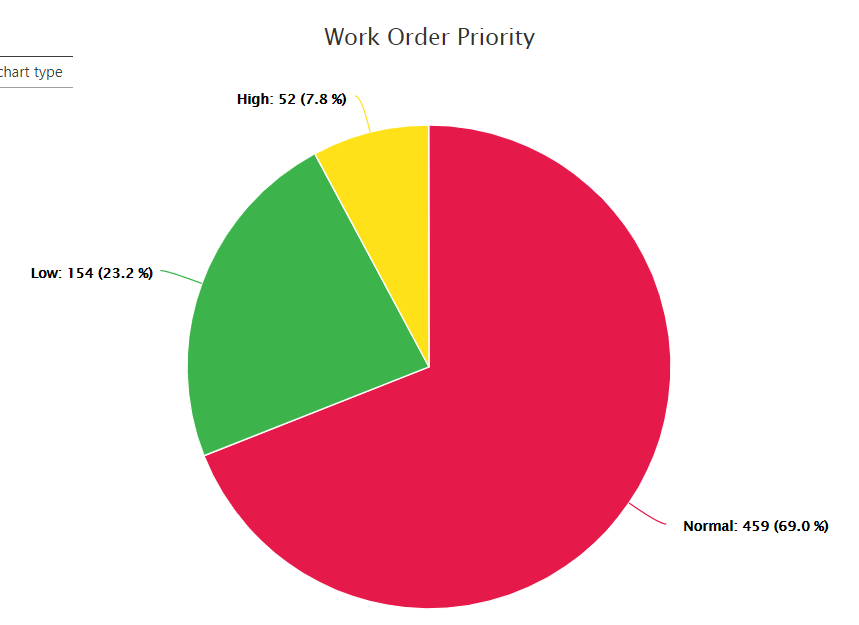
- Select the type of chart that you wish to have displayed on the report from the Chart Type/Format dropdown. For our report, let's start by creating a Pie Chart that is complementary to our report data, showing the percentage of open work orders of each priority.
- In the Chart Size/Position dropdowns, select the desired size and position. We can leave our example as Large, displaying at the Top.
- In the Chart By dropdown, specify the field on which chart data will be summarized (the legend or "series" values). Typically, a text field is used, such as priority, status, or an organizational field such as department or shop. In our example, Priority Desc will be used.
- In the Chart Function dropdown, specify the mathematical function to be performed on the field specified for Chart By in the previous step. In our example, this can be left at Count.
- In the Chart Function For dropdown, numeric fields are listed allowing you to select the field on which the mathematical chart function will be performed. For example, to prepare a chart that displays total work order costs, you would select the total work order cost field from the dropdown. In our example, when a count is being performed, None should be selected.
- Specify a Chart Name/Label for the chart in the prompt provided. The name entered will be displayed directly above your chart on the report.
- To save the chart definition and view it in the report, click the Apply button at the bottom of the Report Setup window. The Report Preview window will display.
Edit Field Labels, Edit Report Descriptions, Report Layout Indicators, and Auto-Refresh
This lesson will share a few reporting tips that users find helpful:
Edit Field Labels
The label that describes each field in your report can be modified as needed. Any change specified will only affect the label shown for this particular report.
To modify a label, return to Report Setup.
- From the Report Setup window, select the field on which you want to modify the label. In our example, select the Parent Location field and click the Edit button.
- The Report Field Options dialog will display. Directly below the default field label is a Field Label (Custom) prompt. Type "Location" in that prompt to indicate that you wish the report to display the label Location rather than Parent Location.
- Click Apply to exit this dialog.
- Click Apply again to return to the Report Preview window and view your change.
Edit Report Description
MC allows you to create a Report Description that can be displayed directly below the Report Title. To modify a Report Description, you must be a member of an access group with access to the Report Setup Advanced tab.
The Report Description is often used to provide additional explanatory information to recipients of the report. To create or modify a Report Description, return to Report Setup.
From the Report Setup window, select the General>Settings sub-tab and ensure the top indicator to Display Report Description is enabled.
- Click on the Advanced>Report Profile sub-tab and enter your desired description in the Description prompt. Enter any text you would like. For example, you could enter text such as the following: Report created using report tutorial.
- Click Apply to return to the Report Preview window and view the description displayed directly below the Report Title.
Report Layout Indicators: Grid Lines and Show Criteria
The General>Settings sub-tab on the Report Setup window includes a set of indicators that allow you to quickly modify the display in the Report Preview window.
The Display Column Lines indicator lets you determine whether your report should include column or grid lines. This feature also makes it easier to dynamically adjust column width in the report. You can simply drag a column line to expand or lessen the column width.
The additional Display indicators let you control how much descriptive information should appear on the report. For example, the Display Report Header indicator controls whether the entire report header section should show on the upper right of the Report Preview window.
The Display Report Description indicator more specifically determines whether any description defined on the Advanced tab should be displayed. With this indicator set off, the above header would appear as follows:

Finally, the Display Report Criteria and Display Format Criteria indicators control whether or not these settings should be included in the report display to provide explanatory information to individuals viewing the report.
See Live Data in Reports with the Auto-Refresh Option
The Auto-Refresh option allows you to see live, up-to-the-minute data without manually refreshing or re-opening reports. This means you can keep critical reports open for a long period of time with the assurance that even rapidly fluctuating data is accurate and current.
Enable this option on a specific report:
- Access the General>Settings sub-tab of the Report Setup window.
- Make sure the Display Report Header check box is selected. Auto-refresh does not work without this option enabled.
- Select a value for the Auto-refresh Interval (minutes) field. The value selected determines how frequently (in minutes) the report should refresh.
- Click the Apply button to save your changes and close the Report Setup window.
This report will now refresh with the desired frequency.
For complete reference information on the Maintenance Connection Reporter, refer to the Online Reporter Guide. The following additional Reporter Tutorials are available in our Knowledge Base:
 Overview and Finding Reports